In this post we will talk about the visualization functionality of CAP Viewer.
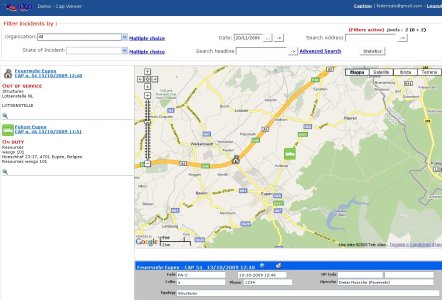
The main screen of the application is shown in the following picture:
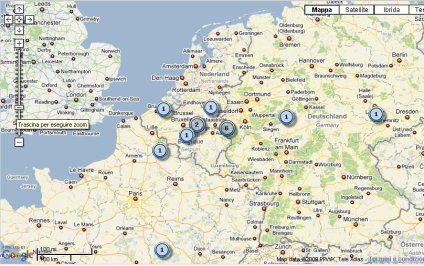
CAP Viewer is able to display on a geographical interface (based on Google Maps) the jixels created with the CAP Generator. The display on the map changes depending on the zoom level set, which can be changed by double clicking on the map or through the zoom control. On large scale the jixels are clustered and displayed through icons showing the number of jixels in that area (view the following image):

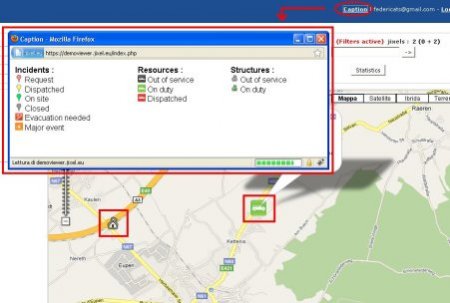
On small?scale (from zoom level 12 up) the jixels are represented differently depending on the type and status of the jixel, as specified in the legend viewable by clicking the appropriate link (view following image):

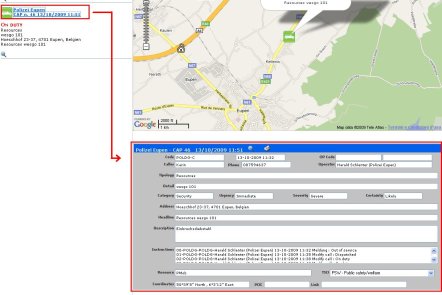
If the zoom level is high enough (from 12 up), the left side of the page shows the list of jixels that are displayed on the map; moreover, clicking on a particular jixel in the list, the related detail card is shown.


