ShakyGround è stato creato con lo scopo di fornire un sistema versatile, affidabile e di facile uso per la stima della risposta dei siti (in termini di carico sismico e di scuotibilità) alle sollecitazioni sismiche. I suoi risultati costituiscono, in effetti, la base sismologica per la progettazione di strutture antisismiche e per l’ottimizzazione della pianificazione territoriale. Le caratteristiche di ShakyGround consentono di identificare in anticipo siti non idonei alla costruzione, di meglio guidare gli esperti nel dimensionamento delle strutture, e di definire con più facilità piani di emergenza in caso di terremoto.
ShakyGround considera il processo alla sorgente sismica e gli effetti di propagazione delle onde come è stato confermato da numerosi studi scientifici e da applicazioni pratiche. In ShakyGround il problema della stima del carico sismico viene affrontato utilizzando la simulazione sintetica di accelerogrammi. L’approccio sintetico offre la possibilità di tener conto delle specifiche condizioni del sito geologico e delle caratteristiche sismotettoniche della zona. L’esperienza dell’utente nel contesto di ShakyGround serve a stabilire i parametri del modello più che a cercare un sismogramma sperimentale o uno spettro di risposta idoneo. ShakyGround consente di variare in modo casuale i parametri dando la possibilità di valutare la stabilità dei risultati in modo statistico. I risultati prodotti da ShakyGround sono l’insieme degli importanti parametri di ingegneria sismica e degli spettri di risposta che possono essere direttamente comparati con gli spettri previsti dalle normative (es. EC8, US Building Code).
ShakyGround è un Software dotato di una moderna interfaccia grafica utente progettata per i sistemi operativi Microsoft Windows (95, 98, NT, 2000, XP) e di un motore di database per l’archiviazione dei modelli e dei risultati. L’interfaccia utente consente di immettere i parametri di ingresso utilizzando dei ‘fogli’ differenti per ogni classe di parametri. Ci sono ‘fogli’ dedicati ai parametri della sorgente, altri ai parametri geotecnici delle stratigrafie, al calcolo degli spettri di risposta, alla posizione dei ricevitori. Questo sistema protegge l’utente da errori causati da errata imputazione o uso dei parametri. Il sistema di database offre all’utente la possibilità di memorizzare i parametri della sorgente e le caratteristiche delle stratigrafie in ‘cataloghi’. In questo modo risulta particolarmente facile e rapido costruire nuovi modelli e calcolare risultati. I modelli derivanti – o non – dai cataloghi possono essere salvati unitamente ai risultati delle simulazioni. La base di dati può essere utilizzata da più utenti in rete ed essere con facilità esportata su Internet/Intranet. ShakyGround produce risultati in formato numerico e grafico: gli spettri di risposta, i sismogrammi simulati sono disponibili per consentire all’utente una immediata valutazione.
Seismic Source
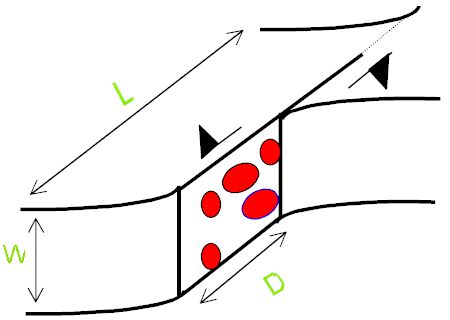
Earthquakes in a classical sense originate from the rapid release of elastic energy caused by the rupture of rock in the earth. Damaging effects due to an earthquake arise (i) from a source outcropping directly at the earths surface, (ii) from the radiated seismic waves. In practice the second effect is the most important. It occurs more frequently and the area shattered by seismic waves is by far larger than the zone which could be hit by an outcropping source. In ShakyGround we focus, therefore, on the effects caused by the radiation of seismic waves. The simulation of the seismic source in ShakyGround follows a stochastic concept as it has been proposed by Hanks & McGuire (1981) and Boore (1983). The source signal, in terms of ground acceleration, is generated as a sequence of gaussian distributed random numbers. The general characteristics of the seismic source are represented by applying a window function in the time domain and filtering the signal with respect to the spectral properties of the seismic source. The concept thus reflects the high variability typically in most accelerograms, which can be reconducted to heterogeneities of the source (the so-called ‘barriers’ or ‘asperities’, schematically indicated by the red spots in the figure). On the other hand, the deterministic frame parameters, like source dimension (represented here by the length L and the width W) and the average dislocation D, are accounted for by the window function and the spectral filtering.

Wave Propagation
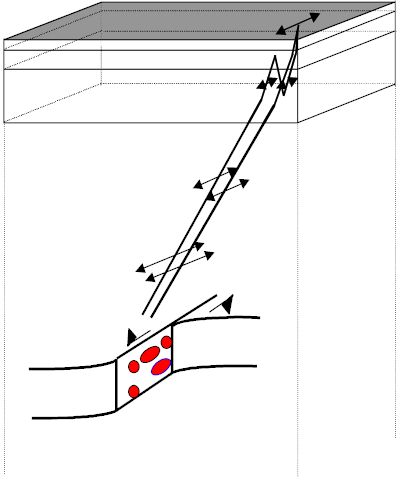
Its now commonly accepted that wave propagation effects have a strong effect on strong ground motion. On their way to the surface, seismic waves undergo modifications due to reflection, refraction and absorption. We account for these effects by the use of Haskell propagator matrices and a complex wave number approach for the absorption. Horizontally polarized S-waves (SH-waves) are considered, since these are the most important ones for earthquake engineering purposes. The geological structure is represented by a sequence of horizontally layered plane strata overlying an infinite halfspace, which contains the seismic source. The seismic signal is strongly affected by the subsurface geological structure. Considerable amplitude amplifications occur if the velocity (and density) of the uppermost layers are lower than the velocities (and densities) of the material below. Thicknesses and velocities of the uppermost layers are typically in a range that makes amplitude amplification effects occur at frequencies between 1 and 20 Hz., i. e., the frequency interval of technical interest. The sketch displays the modifations the seismic signal undergoes on its way from the source to the receiver. Amplitudes are supposed to be large close to the source, then they decrease as the wave travels towards the surface. Within the layer stack the signal is refracted and reflected. In the layers close to the surface, which we suppose to have a low impedance, we observe amplitude amplification.

Structure Response
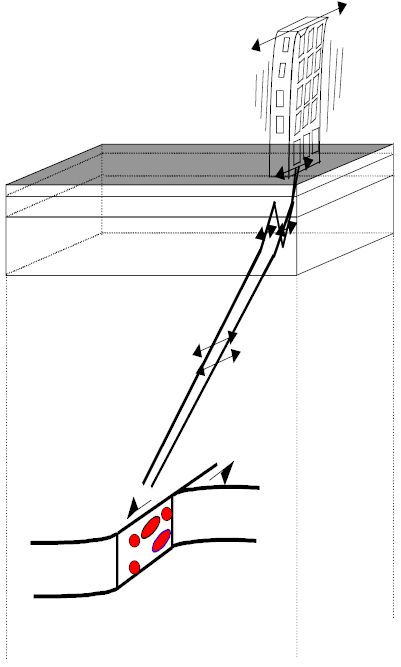
A simple and widely used approach for the representation of the structure response is the so-called “response spectrum” method. Response spectra form the basis of seismic regulation codes, such as the USAEC, US building code in the United States and the EC 8 in Europe. In this context the structure is supposed to behave like a simple oscillator, such as a spring or pendulum. The characteristic parameters of this model are the natural frequency and the damping, which are determined by size, configuration and material makeup of the structure. Earthquake ground motion will excite the building and cause it to “resonate” according to its preferred frequency. The calculation of response spectra consists of several steps. First, select the natural period and damping, then calculate the relative displacement of the oscillator, i. e. its “response” with respect to ground, and note the maximum amplitude of the response. This is repeated for a set of natural frequencies in order to get a “spectrum” of responses. A dangerous situation arises if the natural frequency of a structure falls in the frequency range of major seismic radiation. In this case the accelerations in the structure may be several times higher than the peak ground acceleration measured at the surface.

The users can start a project typing in its name and, if needed, the customer’s name (see figure 1).

Figure 1. The Project Screen
After saving the data, the project is created and the user can start the data entry. Each project can be made by many different “models”. In SHAKYGROUND, “models” are made up of a series of “sheets”, and each of them is related to a specific item of the model, e.g. the seismic source, the geological structure, the response spectra and the general conditions for the calculus. A further sheet supports the configuration of the results. Such “sheets“ concept has been adopted to provide a safe input, to avoid either misspellings or the use of incorrect parameters. The sheets can be stored in the program catalog and re-used for the creation of new models.
The first sheet focuses on the seismic source parameters and their position with respect to the receiver. The random fluctuation of the parameters may also be specified. The user can re-use a previously defined source by scrolling the sources presented in the catalog (“Sources in Catalog” box) and accessing the corresponding source parameters. Otherwise one can specify a new name in the box “Source Name:”, enter a new set of parameters, and finally save the new source in the catalog.

Figure 2. The Source Sheet
The software works together with Google Earth to allow for an easy location of an earthquake. The map of the event is presented in a browser screen on the right hand part of the “Source Sheet” window.

Figure 3. The Strata Sheet
The “Strata” sheet (Figure 3) is made up of two levels. In the box “Stratigraphy” one can select an already existing geological model consisting of a number of layers. The user can define a new layer by using the box “Layer name” or the table below. A already explained for the source parameter sheet, the user can here specify the random fluctuation of the layer parameters. By clicking on the “Insert” button, the new layer is inserted in the layer stack. Any layers can be moved within the layer stack by selecting it in the box at the bottom and using the “Up” and “Down” buttons.
The created geological model can be saved in the catalog with a new name or overwriting an existing one. For zoning projects, the strategy of using pre-defined stratigraphies is particularly effective and safe, since with little effort the user can recombine typical geological conditions at the surface and in the structure underneath.
SHAKYGROUND allows to place the receiver either at the surface or at some interface within the layer stack. With this option the tool allows analysing the case of a building whose base is supposed to be situated at some depth. The default position is set at the ground surface.
The “Additional Data” sheet (Figure 4) contains three different areas: Response Spectrum, General and Output.

Figure 4. The “Additional Data” Sheet
In the “response spectrum” section the user can specify some settings used by the model for calculating the response spectra (type of the response spectrum, frequency bounds and resolution). The default response spectrum is “Acceleration” as required by most seismic regulations, but when needed velocity or displacement response spectra can be selected. The default value for the damping is set to 0.05, i.e., 5% of the critical damping. This damping value is usually considered in standard seismic regulations, but occasionally damping values of 1%, 2%, or 10% have also to be used.
The “General” section of the sheet contains basic information about how to perform the calculations. In the box “Seismogram Information” the user must specify the length of the seismogram and the sampling frequency. In the box “Simulation Parameters” the user selects the number of simulations carried out for the model and the seed value for the generator of the pseudo random numbers. Two further items (box “Statistics Source” and “Statistics Layers”) concern the mode how the program varies the model parameters randomly within the ranges selected in the source parameter and layer sheets. It is possible to configure the model to calculate source and geotechnical parameters according to a uniform or a Gaussian distribution.
The “Output” section is used to specify how SHAKYGROUND should handle the output. Usually a short output, with a report about calculated signal parameters and response spectra, is sufficient. By ticking on “Write single Time series to disk”, the program is configures to write each single synthetic seismogram is on the computer hard disk: such dataset and can be visualized at the end of the run. The same applies for the Response spectra. These features enable the user to access the single time series and response spectra, thus verifying the good choice of the parameters and the performances of the model. Since the time series and response spectra are recorded as plane ASCII files, they can be easily imported by other sophisticated data processing and visualization packages.
SHAKYGROUND offers several levels of output which enable the user to immediately check and evaluate the results of a simulation. After completing the numerical processing, the standard output is generated (example displayed in Figure 5).

Figure 5. Output Window for ShakyGround
It consists of a plot of the response spectra and their statistical variation, and of a table with important signal parameters, i.e., peak ground acceleration, velocity and displacement, RMS-values of the three types of signal, the duration of strong ground motion (calculated following the concept of HUSID-plots), finally corresponding magnitude values (MS deduced from the seismic moment, MWA as obtained from the simulated signals). All these results can be saved to a georeferenced data base, where they can be easily accessed for further processing with GIS-applications.
By choosing “View Results” the program generates a screen displaying the graphical visualization of the single simulated seismograms and response spectra (Figure 6), where the user can scroll the recorded seismograms and response spectra one by one. The accelerograms can be visualized together with velocity, displacement and WOOD-ANDERSON seismograms, as shown in the figure. By choosing a seismogram length different than the one proposed as default, plots can be visualized in their total length or be zoomed.

Figure 6. Single Results
The user may decide which signal types are shown by ticking on/off the selection boxes on left-hand side. The graphical interface allows the editing of the figures so that they can be easily imported in other documents, an extremely useful feature for the preparation of publications and reports.


