SHAKYGROUND is a software tool designed to provide the earthquakes effects estimation in urban, industrial areas and cities.
It provides the user a friendly environment allowing the simulation of strong ground motion by means of synthetic simulation of acceleration seismograms and the estimation of seismic load in a given area.
It forms the seismological base for the design of earthquake-resistant buildings and for land use planning. Moreover, it allows the identification of sites where the expected ground shaking is severe; this can be useful for emergency planning, as well as for enhancing earthquake awareness.
Strong ground motion is seriously affected by wave propagation effects caused by changes due to absorption, reflection and refraction at the boundaries of the geological structures.
The software tool incorporates concepts of the seismic source process and wave propagation effects which are well confirmed by numerous scientific studies and practical applications.
The problem of seismic load estimation is approached by means of synthetic simulation of acceleration seismograms, that gives the possibility to account for the specific geological site conditions and the characteristics of the seismotectonic zone.
The software works together with Google Earth to allow for an easy location of an earthquake.
Expected Results
SHAKYGROUND provides the user with a user friendly interface for tackling the complex problem of the assessment of seismic hazard.
The user interface allows to enter input values related to:
– the seismic source parameters
– the geotechnical parameters
– the calculation of response spectra
– some general information concerning the operation of program and its output.
The user’s experience is exploited for establishing the model parameters rather than for the search of a “suitable” experimental example seismogram. The mentioned simulation tool allows to vary the geotechnical and source parameters randomly disclosing the possibility to evaluate the stability of the results statistically.
Finally the program produces a report of important simulated engineering seismological signal parameters together with response spectra which can be directly compared to standard seismic codes (for ex. EC8, US Building Code).
The different levels of output enable the user to immediately check and evaluate the results of a simulation, which consist of:
– a plot of the response spectra and their statistical variation
– a table with important signal parameters, i.e., peak ground acceleration, velocity and displacement, the duration of strong ground motion, finally corresponding magnitude values.
Moreover the user can save results to a georeferenced data base, where they can be easily accessed for further processing with GIS-applications.
Benefits
The benefits on using ShakyGround can be distinguished basing on the different categories of users.
1) Public Agencies (local, regional, national) interested to territory planning, emergency planning and seismic microzoning
Public Agencies may use SHAKYGROUND to identify critical points in a territory, spotting where damages would be grater if an earthquake should occur. The model can help the identification of areas and sites where severe ground shaking is expected, so that competent public authorities can adjust their territory planning (emergency, territorial, microzoning etc.).
2) Civil engineers, geologic and geotechnical consultants
These users may use SHAKYGROUND to obtain numerical data of earthquake ground motion at the level of the foundation of a building.
At the same time they can obtain the prevision of the seismic impact in a specific site where a building is planned to be erected or reconstructed or reinforced. Moreover they can insert the schemes of the synthetic seismogram resulted by the run of the simulations as input for their calculations.
3) Civil Protection
The necessities of these users are the same of those of the Public Agencies. The critical sites location allows the territorial planning and the emergency planning optimization. It will be possible to identify zones where earthquake damages will be particularly serious.
People living in these areas will have greater need of aid, and at the same time these areas would not have to be chosen for the deployment of first aid structures.
4) Insurance and re-insurance Companies
Companies that want to propose insurances contracts covering damages to buildings caused by earthquake, can use SHAKYGROUND to classify all sites on the basis of the estimated effects for several earthquake scenarios. The so obtained results of the seismic zoning would help the insurance companies to develop a specific marketing strategy for each of these areas.
Technical Approach
SHAKYGROUND is a software that runs on Microsoft Windows operating systems (95, 98, NT, 2000, XP, VISTA) and is based on the .NET 2.0 Framework and Visual Basic programming language.
Seismic Source
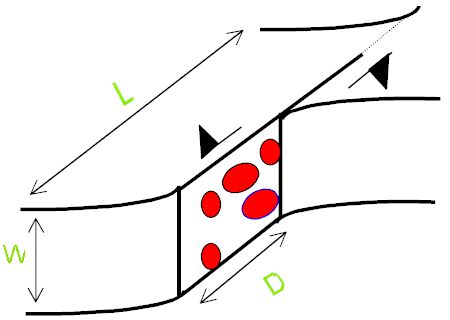
Earthquakes in a classical sense originate from the rapid release of elastic energy caused by the rupture of rock in the earth. Damaging effects due to an earthquake arise (i) from a source outcropping directly at the earths surface, (ii) from the radiated seismic waves. In practice the second effect is the most important. It occurs more frequently and the area shattered by seismic waves is by far larger than the zone which could be hit by an outcropping source. In ShakyGround we focus, therefore, on the effects caused by the radiation of seismic waves. The simulation of the seismic source in ShakyGround follows a stochastic concept as it has been proposed by Hanks & McGuire (1981) and Boore (1983). The source signal, in terms of ground acceleration, is generated as a sequence of gaussian distributed random numbers. The general characteristics of the seismic source are represented by applying a window function in the time domain and filtering the signal with respect to the spectral properties of the seismic source. The concept thus reflects the high variability typically in most accelerograms, which can be reconducted to heterogeneities of the source (the so-called ‘barriers’ or ‘asperities’, schematically indicated by the red spots in the figure). On the other hand, the deterministic frame parameters, like source dimension (represented here by the length L and the width W) and the average dislocation D, are accounted for by the window function and the spectral filtering.

Wave Propagation
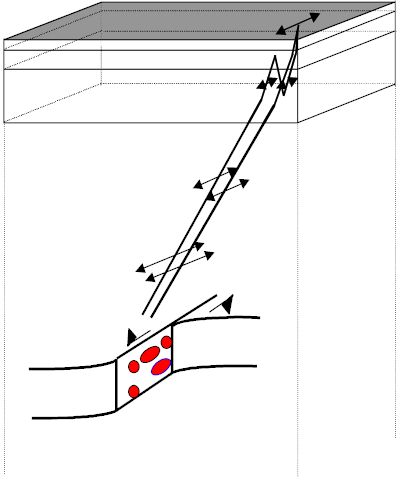
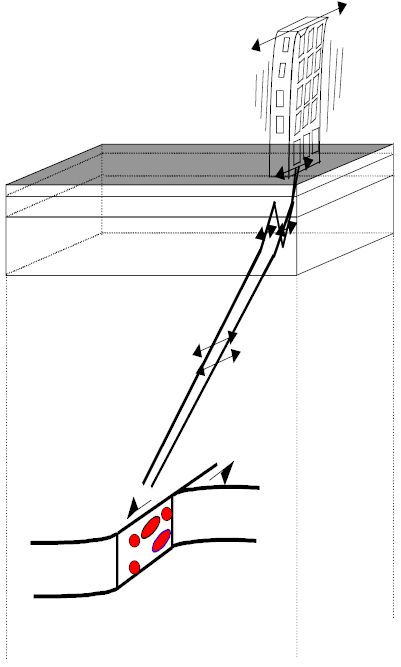
Its now commonly accepted that wave propagation effects have a strong effect on strong ground motion. On their way to the surface, seismic waves undergo modifications due to reflection, refraction and absorption. We account for these effects by the use of Haskell propagator matrices and a complex wave number approach for the absorption. Horizontally polarized S-waves (SH-waves) are considered, since these are the most important ones for earthquake engineering purposes. The geological structure is represented by a sequence of horizontally layered plane strata overlying an infinite halfspace, which contains the seismic source. The seismic signal is strongly affected by the subsurface geological structure. Considerable amplitude amplifications occur if the velocity (and density) of the uppermost layers are lower than the velocities (and densities) of the material below. Thicknesses and velocities of the uppermost layers are typically in a range that makes amplitude amplification effects occur at frequencies between 1 and 20 Hz., i. e., the frequency interval of technical interest. The sketch displays the modifations the seismic signal undergoes on its way from the source to the receiver. Amplitudes are supposed to be large close to the source, then they decrease as the wave travels towards the surface. Within the layer stack the signal is refracted and reflected. In the layers close to the surface, which we suppose to have a low impedance, we observe amplitude amplification.

Structure Response
A simple and widely used approach for the representation of the structure response is the so-called “response spectrum” method. Response spectra form the basis of seismic regulation codes, such as the USAEC, US building code in the United States and the EC 8 in Europe. In this context the structure is supposed to behave like a simple oscillator, such as a spring or pendulum. The characteristic parameters of this model are the natural frequency and the damping, which are determined by size, configuration and material makeup of the structure. Earthquake ground motion will excite the building and cause it to “resonate” according to its preferred frequency. The calculation of response spectra consists of several steps. First, select the natural period and damping, then calculate the relative displacement of the oscillator, i. e. its “response” with respect to ground, and note the maximum amplitude of the response. This is repeated for a set of natural frequencies in order to get a “spectrum” of responses. A dangerous situation arises if the natural frequency of a structure falls in the frequency range of major seismic radiation. In this case the accelerations in the structure may be several times higher than the peak ground acceleration measured at the surface.

The users can start a project typing in its name and, if needed, the customer’s name (see figure 1).

Figure 1. The Project Screen
After saving the data, the project is created and the user can start the data entry. Each project can be made by many different “models”. In SHAKYGROUND, “models” are made up of a series of “sheets”, and each of them is related to a specific item of the model, e.g. the seismic source, the geological structure, the response spectra and the general conditions for the calculus. A further sheet supports the configuration of the results. Such “sheets“ concept has been adopted to provide a safe input, to avoid either misspellings or the use of incorrect parameters. The sheets can be stored in the program catalog and re-used for the creation of new models.
The first sheet focuses on the seismic source parameters and their position with respect to the receiver. The random fluctuation of the parameters may also be specified. The user can re-use a previously defined source by scrolling the sources presented in the catalog (“Sources in Catalog” box) and accessing the corresponding source parameters. Otherwise one can specify a new name in the box “Source Name:”, enter a new set of parameters, and finally save the new source in the catalog.

Figure 2. The Source Sheet
The software works together with Google Earth to allow for an easy location of an earthquake. The map of the event is presented in a browser screen on the right hand part of the “Source Sheet” window.

Figure 3. The Strata Sheet
The “Strata” sheet (Figure 3) is made up of two levels. In the box “Stratigraphy” one can select an already existing geological model consisting of a number of layers. The user can define a new layer by using the box “Layer name” or the table below. A already explained for the source parameter sheet, the user can here specify the random fluctuation of the layer parameters. By clicking on the “Insert” button, the new layer is inserted in the layer stack. Any layers can be moved within the layer stack by selecting it in the box at the bottom and using the “Up” and “Down” buttons.
The created geological model can be saved in the catalog with a new name or overwriting an existing one. For zoning projects, the strategy of using pre-defined stratigraphies is particularly effective and safe, since with little effort the user can recombine typical geological conditions at the surface and in the structure underneath.
SHAKYGROUND allows to place the receiver either at the surface or at some interface within the layer stack. With this option the tool allows analysing the case of a building whose base is supposed to be situated at some depth. The default position is set at the ground surface.
The “Additional Data” sheet (Figure 4) contains three different areas: Response Spectrum, General and Output.

Figure 4. The “Additional Data” Sheet
In the “response spectrum” section the user can specify some settings used by the model for calculating the response spectra (type of the response spectrum, frequency bounds and resolution). The default response spectrum is “Acceleration” as required by most seismic regulations, but when needed velocity or displacement response spectra can be selected. The default value for the damping is set to 0.05, i.e., 5% of the critical damping. This damping value is usually considered in standard seismic regulations, but occasionally damping values of 1%, 2%, or 10% have also to be used.
The “General” section of the sheet contains basic information about how to perform the calculations. In the box “Seismogram Information” the user must specify the length of the seismogram and the sampling frequency. In the box “Simulation Parameters” the user selects the number of simulations carried out for the model and the seed value for the generator of the pseudo random numbers. Two further items (box “Statistics Source” and “Statistics Layers”) concern the mode how the program varies the model parameters randomly within the ranges selected in the source parameter and layer sheets. It is possible to configure the model to calculate source and geotechnical parameters according to a uniform or a Gaussian distribution.
The “Output” section is used to specify how SHAKYGROUND should handle the output. Usually a short output, with a report about calculated signal parameters and response spectra, is sufficient. By ticking on “Write single Time series to disk”, the program is configures to write each single synthetic seismogram is on the computer hard disk: such dataset and can be visualized at the end of the run. The same applies for the Response spectra. These features enable the user to access the single time series and response spectra, thus verifying the good choice of the parameters and the performances of the model. Since the time series and response spectra are recorded as plane ASCII files, they can be easily imported by other sophisticated data processing and visualization packages.
SHAKYGROUND offers several levels of output which enable the user to immediately check and evaluate the results of a simulation. After completing the numerical processing, the standard output is generated (example displayed in Figure 5).

Figure 5. Output Window for ShakyGround
It consists of a plot of the response spectra and their statistical variation, and of a table with important signal parameters, i.e., peak ground acceleration, velocity and displacement, RMS-values of the three types of signal, the duration of strong ground motion (calculated following the concept of HUSID-plots), finally corresponding magnitude values (MS deduced from the seismic moment, MWA as obtained from the simulated signals). All these results can be saved to a georeferenced data base, where they can be easily accessed for further processing with GIS-applications.
By choosing “View Results” the program generates a screen displaying the graphical visualization of the single simulated seismograms and response spectra (Figure 6), where the user can scroll the recorded seismograms and response spectra one by one. The accelerograms can be visualized together with velocity, displacement and WOOD-ANDERSON seismograms, as shown in the figure. By choosing a seismogram length different than the one proposed as default, plots can be visualized in their total length or be zoomed.

Figure 6. Single Results
The user may decide which signal types are shown by ticking on/off the selection boxes on left-hand side. The graphical interface allows the editing of the figures so that they can be easily imported in other documents, an extremely useful feature for the preparation of publications and reports.


